Categories
Archives
- September 2024
- August 2024
- July 2024
- June 2024
- April 2024
- March 2024
- January 2024
- December 2023
- October 2023
- September 2023
- August 2023
- July 2023
- May 2023
- April 2023
- February 2023
- January 2023
- November 2022
- October 2022
- September 2022
- July 2022
- May 2022
- April 2022
- February 2022
- January 2022
- December 2021
- November 2021
- September 2021
- August 2021
- July 2021
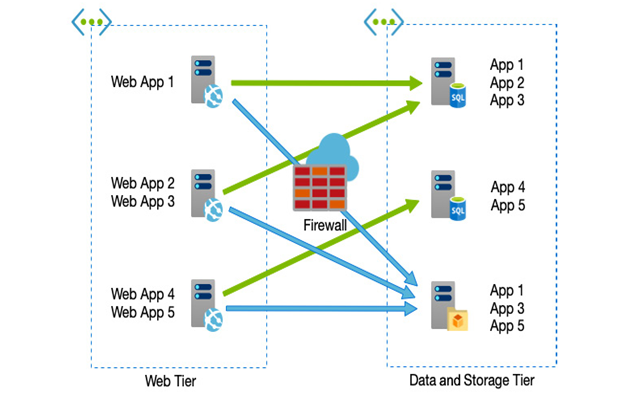
Very few applications run in isolation on a single server. The majority will be split across multiple servers; for example, web applications may consist of a web server frontend and a backend database. To further complicate matters, some systems may share resources – multiple applications may share the same backend databases, and web servers may host multiple websites. There might also be a crossover in this sharing, as depicted in the following diagram:

Figure 10.1 – Applications are often spread across shared servers
Therefore, the discovery phase of the migration involves not only producing an inventory of servers, databases, and services in scope but a dependency matrix as well.
Once you have identified the components of the systems, you must investigate how they communicate. Firewalls and routers may exist between different layers of any one solution, and therefore the rules also need to be captured to ensure they can still communicate post-migration. Consideration must also be made for IP addressing and DNS – will your on-premises network extend into Azure as a flat network (a single subnet), or will it be segregated using a different subnet?
Your network schema will determine whether services will receive a new IP address once migrated or use the current address, which has an impact on the DNS and potentially the configuration of n-tier systems – have tiers been configured to contact upstream and downstream tiers directly via an IP address, a DNS name, or some other means?
Finally, you will also need to consider the impact the actual migration will have on end users. There will be service interruption at some point, and depending on the complexity, more than one system may be impacted when you switch over.
There are several tools to assist with the technical discovery of your systems – including several third-party applications such as Movere (recently acquired by Microsoft), Cloudamize, Current Tech, and ATADATA, as well as Azure’s own Azure Migrate.
However, in many organizations, systems will have business owners – stakeholders who manage and understand your applications at a detailed level, including the history and potential problems you might encounter.
You should also collate any documentation and service designs to aid in the process to help map out the end-to-end architecture of each solution.
As mentioned, there are several tools to assist with the discovery exercise, including Azure Migrate. The Azure Migrate tool consists of an appliance (a virtual machine with a collector and discovery tool pre-installed) that must be installed and run on your on-premises environment.
There are two versions of the appliance, one for Hyper-V and one for VMware – in either case, the process for downloading and configuring the tool is as follows:
- Create an Azure Migrate: Server Assessment project in the Azure Migrate blade of the Azure portal.
- Download the appliance.
- Install and run the appliance by importing it as a VM into either Hyper-V or VMware.
- Start the discovery process.
- Once the discovery has finished, create an assessment.
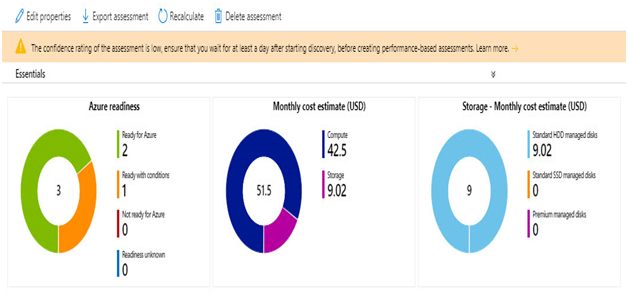
The final assessment step creates a report similar to the one in the following screenshot:

Figure 10.2 – Example Azure Migrate assessment report
The assessment report shows how many VMs have been discovered and are ready for migration, an estimate of the monthly cost of each VM when migrated to Azure, and an estimate of the monthly storage costs.
Tip
The complete end-to-end process for creating and running a full assessment is documented in the book Implement Microsoft Azure Architect technologies: AZ303 Exam Prep and Beyond, by myself, Brett Hargreaves, and Sjouke Zaal – also by Packt Publishing.
The Azure Migrate tool is not the only way to help assess your on-premises servers and solutions. We mentioned earlier that understanding dependencies between servers is also an essential requisite.
Azure Service Map is an optional add-on solution available for Log Analytics workspaces. When enabled, the Service Map tool works with a dependency agent and the Log Analytics agent that must be installed on all your on-premises VMs. The tool will then create a visual map of all identified services and how they relate to each other.
Tip
Log Analytics workspaces are covered in Chapter 15, Designing for Logging and Monitoring.
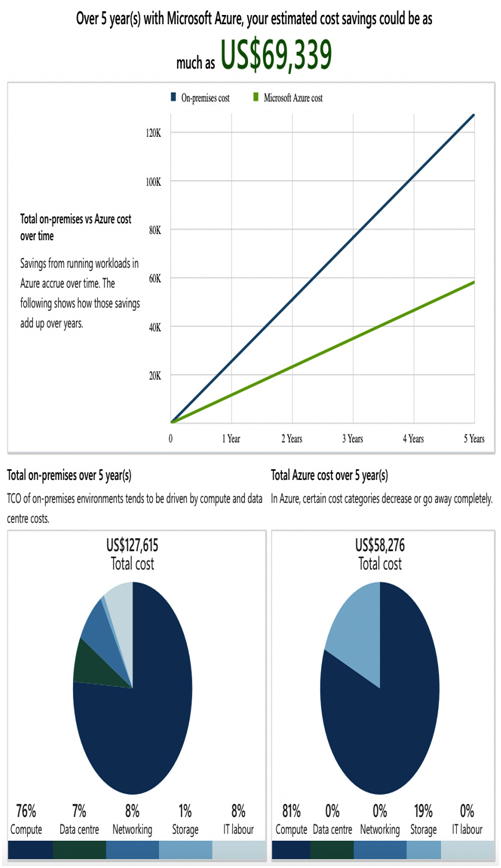
Another useful tool is the Azure Total Cost of Ownership (TCO) calculator. Whereas the Azure Migrate assessment report will provide an estimate of run costs for each virtual machine, the TCO calculator takes detailed information on your on-premises workloads and provides a breakdown estimate of what a comparable service in Azure might cost.
The TCO calculator is a free tool available at https://azure.microsoft.com/en-gb/pricing/tco/calculator/ and produces reports similar to that in the following screenshot:

Figure 10.3 – TCO calculator report
Once you understand your on-premises environment, you can start to plan how your new environment will look.

Leave a Reply