Categories
Archives
- September 2024
- August 2024
- July 2024
- June 2024
- April 2024
- March 2024
- January 2024
- December 2023
- October 2023
- September 2023
- August 2023
- July 2023
- May 2023
- April 2023
- February 2023
- January 2023
- November 2022
- October 2022
- September 2022
- July 2022
- May 2022
- April 2022
- February 2022
- January 2022
- December 2021
- November 2021
- September 2021
- August 2021
- July 2021
Azure has several opportunities for enhancing performance and security that you may not have used with your on-premises systems. It is also possible that your existing servers were underutilized or even overutilized, which can impact costs.
Therefore, once migrated, you should monitor your workloads for performance trends, security enhancements, or cost optimizations.
To support these tasks, Azure provides the following tools:
- Azure Monitor
- Azure Cost Management
- Azure Advisor
Let’s look at each one to see how they can help optimize your environment.
Azure Monitor
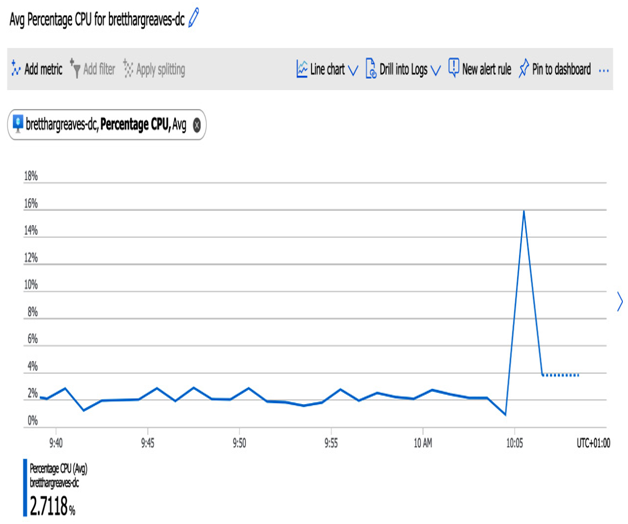
We cover Azure Monitor in more detail in Chapter 15, Designing for Logging and Monitoring; however, you can use Azure Monitor to record and report on performance metrics as a brief introduction. By analyzing trends over time, you can gain deep insights into a VM’s usage, as you can see in the following example screenshot:

Figure 10.6 – Monitoring VM CPU performance
Suppose you see over some time that CPU, RAM, and disk I/O are all consistently under a low threshold (for example, never going above 10%). In that case, this can be a good indication that your VM is a higher specification than required. By reducing the size to a small version, you can substantially reduce costs.
Similarly, the inverse may be true – in other words, if you consistently see CPU and RAM over 80%, you may need to increase the size to gain performance.
Azure Cost Management
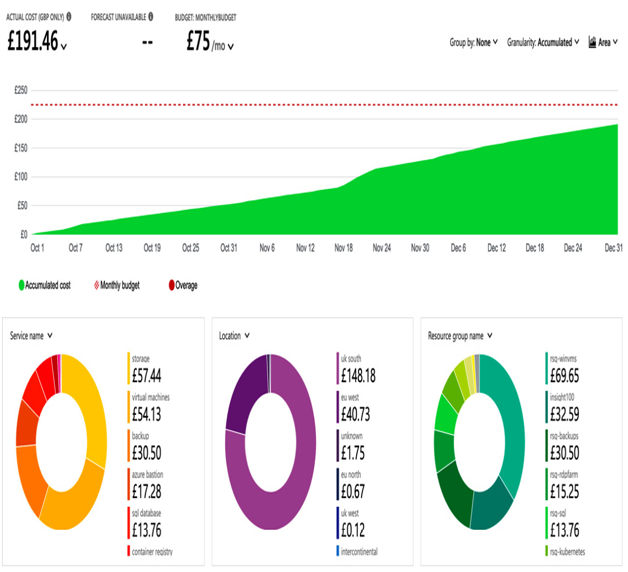
Azure Cost Management will show you Azure costs over time and also allows you to define views to help understand where your highest costs are. The following screenshot shows the default view displaying spend by service, location, and resource group:

Figure 10.7 – Azure Cost Management
You can tailor this view as you see fit – filter or group by Service Name, Metric, Meter, Service Tier, and more. You can also visualize your costs through different chart types or even output the entire list in a table.
By closely monitoring costs and spending by resource over time, you gain a unique insight into your highest utilized, most expensive, and fastest-growing components.
For example, by drilling down through the different filter options, you might discover that a particular storage account is increasing in costs month on month, which in turn can help you investigate why and potentially reduce costs.

Leave a Reply